Portfolio Tracking
Track and manage your investments effortlessly with our portfolio tracking tool.

Can your portfolio tracker answer these questions?
What is your total open pnl across multiple brokers?
Don't you hate logging into 4 different brokers to see how your positions are doing? Have a complete picture of all your accounts from a single screen.
What is the weight of each position in your portfolio?
See how your portfolio positions are weighted by their cost of acquisition and open pnl.
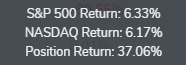
Is your portfolio beating the benchmarks?
Benchmark your positions and see how they are doing when compared to the S&P and Nasdaq returns from the date your opened them.
What is your pnl curve, if all positions are closed?
See how your equity curve will look like in real time, if all positions are closed.
How balanced is your portfolio?
See how much you have allocated to cash and other asset types including long and short exposure.
What is the maximum risk of your entire portfolio?
Add your stops and targets and our system will calculate important risk metrics for each position and for the entire account.
More Features & Benefits
Total days held
See how long you held your positions and benchmark them against the S&P and Nasdaq.
Options data
Track your options expiration dates and how long you have until expiration. See greeks and underlying prices.
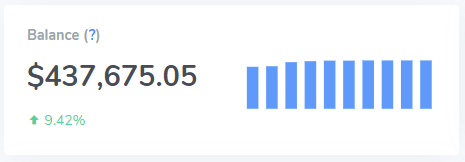
Full balance
See your total balance of all closed/open/cash transactions for one or all accounts.
Track multiple risk metrics
Track open r-multiples, stops, targets, partially closed pnl, cost, % returns, avg price, open risk and much more.
Advanced filters and options
Drill down on the information that matters. Filter your open positions by strategies, accounts or symbols.
Multi Markets
Trading journal suitable for stocks, futures, options, forex, cdfs, cryptos and other markets. Visit our help page for a full list of supported assets.
Join 80,000+ users worldwide who rely on our platform to track and manage their investment portfolios.
See Pricing Get a free account