
No credit card required. Fully test your integration/upload process.
Many brokers allow auto import/sync, but you can still import a file from your broker.
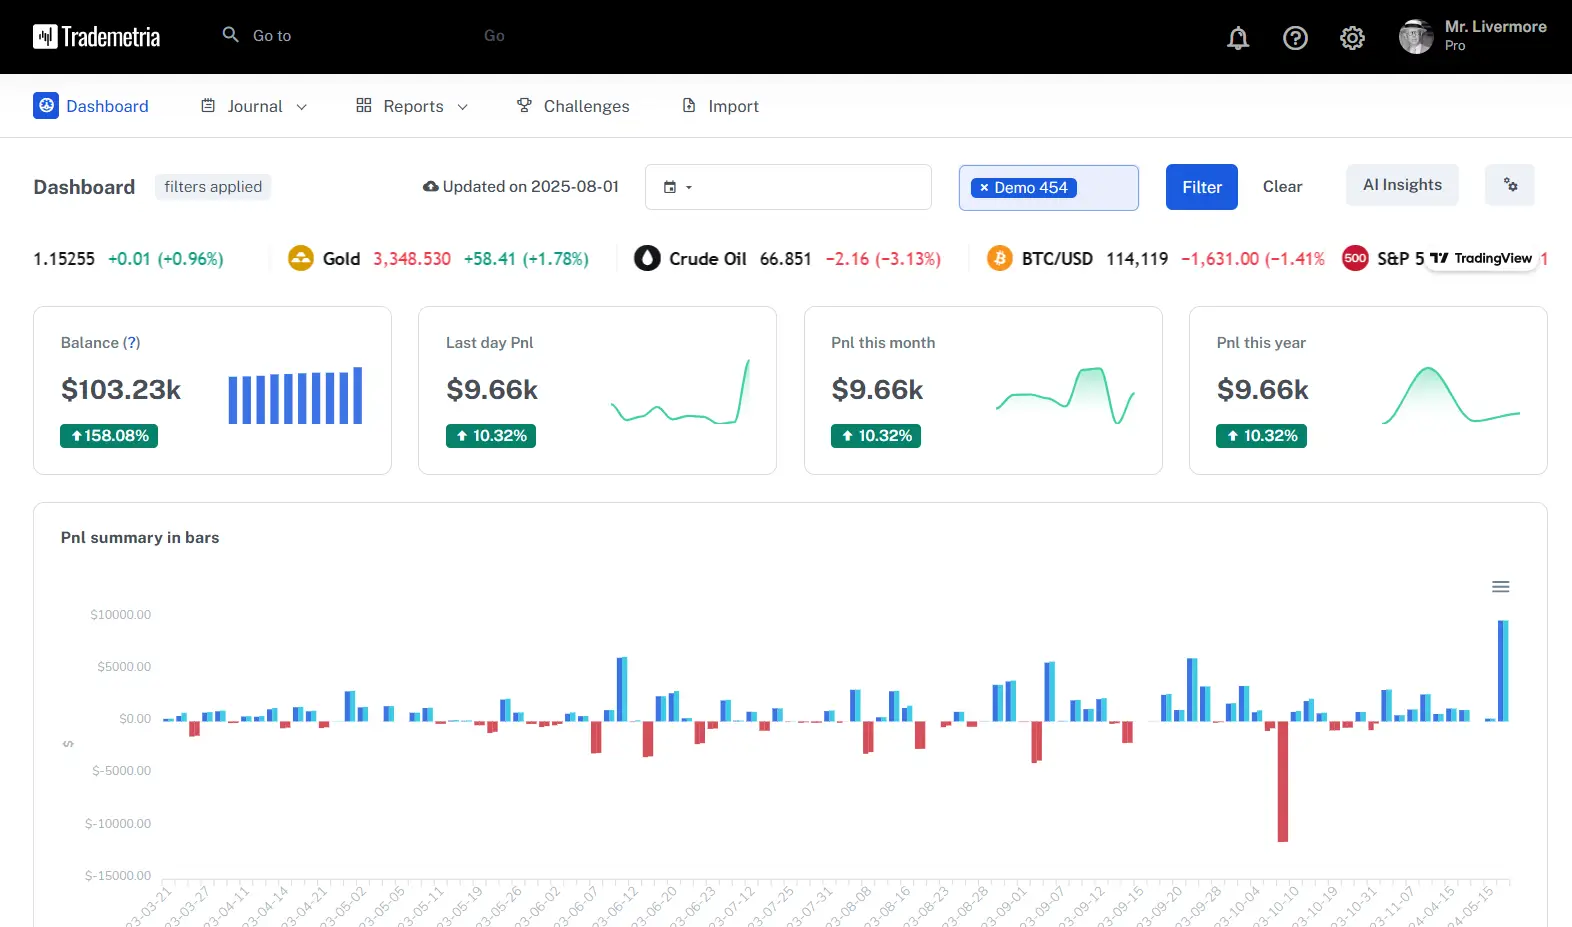
Track, analyze, optimize your trading performance.
Best option Sync using Schwab's api here.
Watch this video to learn how to generate the correct file to import.
This option won't add your commission and fees. Check the box 'add default commissions' if you want track/set default commission and fees. If you don't trade options or trade only simple strategies like buy and sell you can use the 'Thinkorswim (Cash Balance)' option above this one. It will automatically add your commission and fees.
How to generate the file:
Fed up with juggling logins across multiple brokers to track your portfolio? Our system streamlines everything, consolidating your portfolio on one screen. Plus, keep tabs on your favorite assets through watchlists.
Say goodbye to those cumbersome trading spreadsheet. Embrace our fully searchable WYSIWYG HTML editor, which allows you to effortlessly record your trading events, complete with unlimited storage for trading-related images.
Import trades instantly via api sync, broker files or manual entries. Compatible with 1500+ platforms and brokers worldwide.
Set account goals, add your own commissions, custom fees, adjustments and have full control of your trading business per account or altogether.
Research financial information, earning dates, charts and company profile from 20+ world exchanges. Powered by Trading View.
Trading journal suitable for stocks, futures, options, forex, cdfs, cryptos and other markets. Visit our help page for a full list of supported assets.
Share your trades and metrics with your mentor or community and bring extra accountability to your business.
Track your broker fees, dividends, deposits, withdrawals, platform fees, you name it. Trademetria is also an accounting system, but made for traders and investors.
Powerful REST API to create custom applications or seamlessly showcase your statistics on your website or application.
Delete, add, edit trades in batch. Type data just like an excel spreadsheet.
Monitor outcomes for individual legs and spreads. Generate spread-specific reports to uncover your best performing options strategies.
Choose among dark, white or build your own theme. Customize journal templates, default language, report formats, language, filter settings and more.
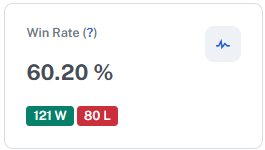
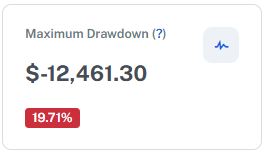
Profit factor, expectancy, holding times, win rate, daily win rate, long/short ratios, averages, projections, totals and many more.
See a chart with your entry and exit points of single or multiple trades for the day or a particular asset. Great for scalpers or swing traders.
Don't like to type? Upload your trading related images and have your own searchable image database.