What Are R-Multiples? The Key Metric Every Trader Should Know

What Are R-Multiples? The Key Metric Every Trader Should Know
What Is an R-Multiple?
An R-multiple is a measurement of a trade's profit or loss relative to the amount risked. The "R" stands for the initial risk you take on a trade, usually defined as the difference between your entry price and your stop-loss level.
For example, if you enter a trade at $100 and place a stop-loss at $95, your risk (1R) is $5. If you later exit the trade at $110, your profit is $10, which is 2R (2 times the amount risked).
Why R-Multiples Matter
R-multiples are essential for several reasons:
- Standardization: R-multiples allow you to compare trades across different assets and strategies on an equal footing.
- Performance Evaluation: You can measure the effectiveness of your trading system by tracking the distribution of R-multiples across many trades.
- Risk Management: They reinforce disciplined risk-taking and proper position sizing.
- Psychological Edge: Focusing on R instead of dollar amounts can reduce emotional bias and improve decision-making.
Who Created the R-Multiple Concept?
The concept was introduced by Dr. Van K. Tharp, a renowned trading coach, in his work on position sizing and trading psychology. His books such as Trade Your Way to Financial Freedom have educated thousands of traders about how to view risk and performance in a systematic way. Let's look at a few examples:
Example 1: A Winning Trade
Let’s say you buy a stock at $50 and place a stop-loss at $48. Your risk (1R) is $2.
- Entry: $50
- Stop-Loss: $48
- Exit Price: $56
- Profit: $6
Your R-multiple is $6 / $2 = 3R. This means you earned 3 times what you risked.
Example 2: A Losing Trade
Now consider a trade where you go short at $120, with a stop at $123, risking $3 per share.
- Entry: $120 (short)
- Stop-Loss: $123
- Exit Price: $122
- Loss: $2
Your R-multiple is -$2 / $3 = -0.67R. This helps you quantify the trade in risk units, not just dollars.
Now, let's look at a r-multiples chart with all trades done by a trader:
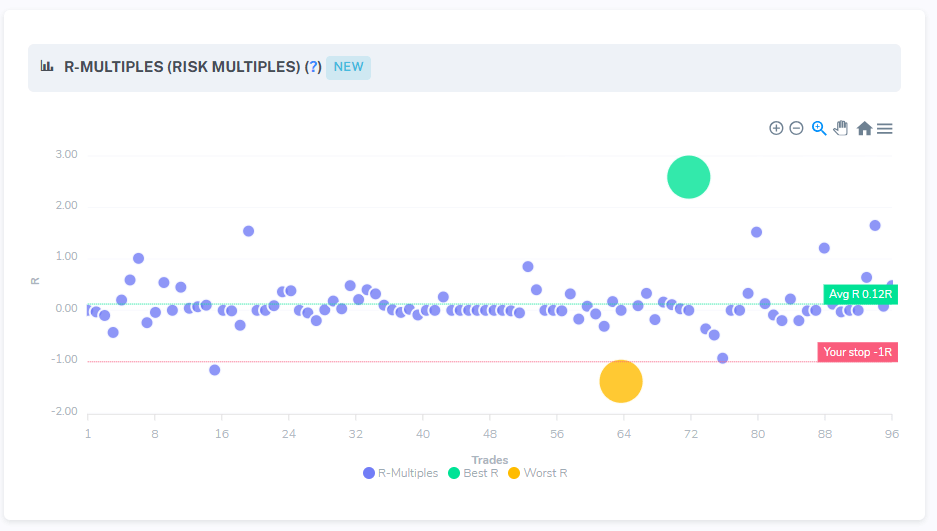
From this chart, we can make a few good conclusions:
- The trader respects his stop and has good discipline. A -1R trade means that the trader exited exactly at his stop. Anything below means that the trader violated one of the most important rules in trading. In this chart, the trader only violated his stop once.
- The trader is consistently generating good trades, but his average is only 0.12R. This trader is exiting his trades too early and barely making a profit.
- The trader is probably risking more than his tolerance level, adding emotional risk to the trade and exiting trades for a small profit.
Three very important insights that can be proven with data from a single chart!
Using R-Multiples to Improve Your Trading
By tracking R-multiples over time, you can create a performance profile of your trading system. For example:
- Average R: Are your wins averaging more than your losses?
- Expectancy: Are you consistently earning positive R across many trades?
- Distribution: Do you have occasional big winners (5R or more) that help offset multiple small losses?
This kind of analysis is more insightful than just looking at win rate or net profit alone. At Trademetria, you can track all these metrics and more.
Final Thoughts
R-multiples are more than just a tool, they’re a mindset. They train you to think in terms of risk and reward, which is the cornerstone of sustainable trading success. Whether you're a beginner or a seasoned investor, understanding and applying the R-multiple concept can elevate your trading to a professional level.
At Trademetria, you must add your stop losses to your trades in order to calculate r-multiples. We offer multiple ways to add them including directly into the table (like excel), mass editing or via trade details. Stops can be in either $ or %.